This course offers a comprehensive introduction to data visualization using R, starting with the basics of the R language and progressing through essential data wrangling and preprocessing techniques using dplyr and tidyr. You’ll learn to create powerful and insightful visualizations with ggplot2, build interactive dashboards, and explore advanced customization to enhance your visual storytelling. Whether you're new to R or looking to deepen your data visualization skills, this course equips you with the tools to turn complex data into clear, impactful visuals.
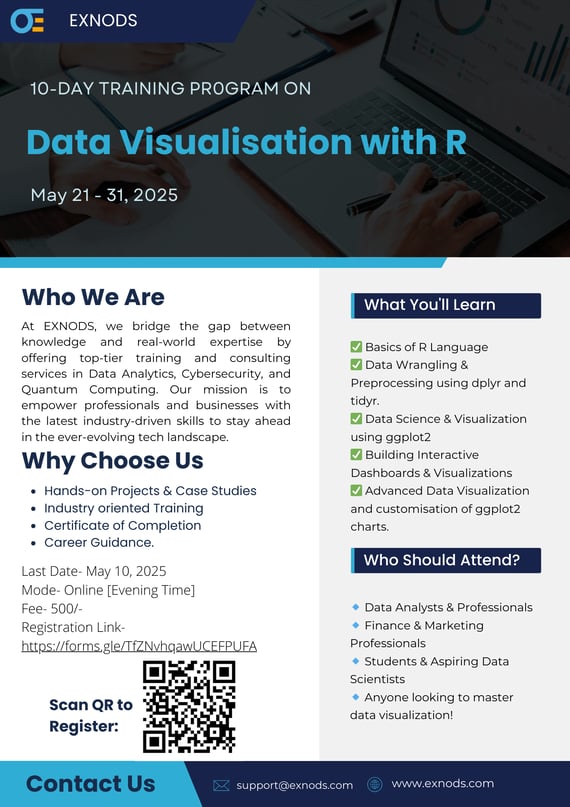
What You'll Learn:
✅ Basics of R Language
✅ Data Wrangling & Preprocessing using dplyr and tidyr.
✅ Data Science & Visualization using ggplot2
✅ Building Interactive Dashboards & Visualizations
✅ Advanced Data Visualization and customisation of ggplot2 charts.
Last Date- May 10, 2025
Mode- Online [Evening Time]
Fee- 500/-
Registration Link- https://forms.gle/TfZNvhqawUCEFPUFA